The new 3.7 version of Server Genius was been released yesterday. Server Genius is the most comprehensive monitoring and reporting tool for Windows servers. Besides its essential monitoring features providing hardware data metrics, Server Genius tracks Remote Desktop sessions and Windows Application processes which allow administrators to get a good understanding of 'Who is doing What and When.'
PRAGUE, November 21, 2018 (Newswire.com) - Server Genius Monitors Multiple Servers And Prevents Failure
The Server Genius monitoring agent can easily be deployed on multiple servers - Windows or Linux web - to record production’s events, data and users’ activity. With the Web Dashboard, the administrator can easily drill down into each one of his Windows or Web servers to review an instant display of relevant graphs and accurate activity reports per day, week or month.
The information for each server’s activity - resources consumption, remote desktop sessions, running applications - is centralized into Server Genius database. The management dashboard is a web application, so the administrator is able to monitor his servers from anywhere, even when he is on the move. The Web Dashboard is the most valuable monitoring tool for the IT outsourcing support team to remotely help the administrator in case of production issue. Administrators get an overview of their servers at a single glance, which allows them to quickly react accordingly. As soon as a server goes down or shows any suspicious behavior, it flashes in red to attract attention. With the 3.7 release, the Dashboard is automatically refreshed each time the administrator accesses it. It’s then possible to dig into more detailed information to analyze situations over a designated period of time in order to audit precisely where the problem occurred and to durably solve it.
Server Genius Provides Accurate Insights into Production State
Server Genius makes it quick and easy for Windows administrators to check the overall performance of their production servers, based on data about remote desktop session activity as well as metrics on resource utilization (memory size, CPU, Disk, I/O, etc.). A warning is sent as soon a resource is over-passing limits. As such, they can easily audit their IT infrastructure, anticipate future investments and avoid major issues.
To warrant the continuity and stability of businesses’ activity, and keep improving users’ satisfaction, Server Genius provides useful information about the health of RDS servers and websites, checking their constant availability and responsiveness.
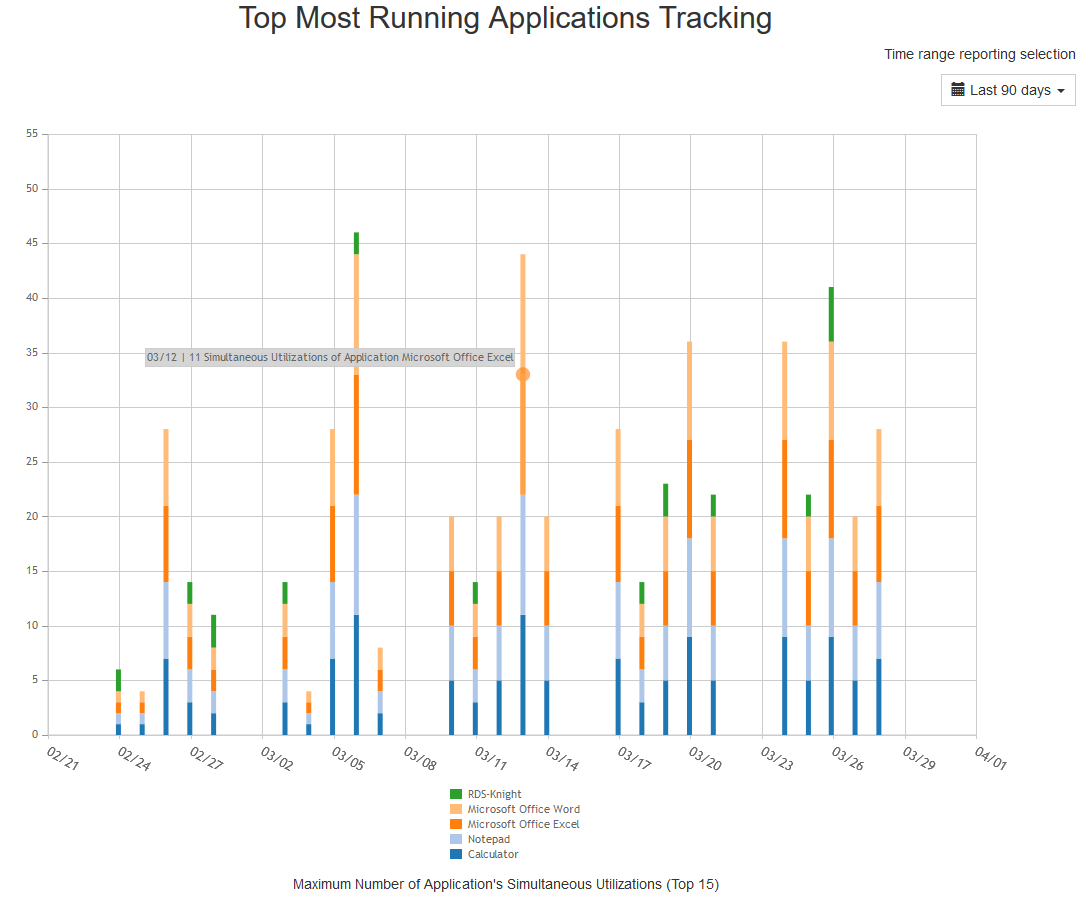
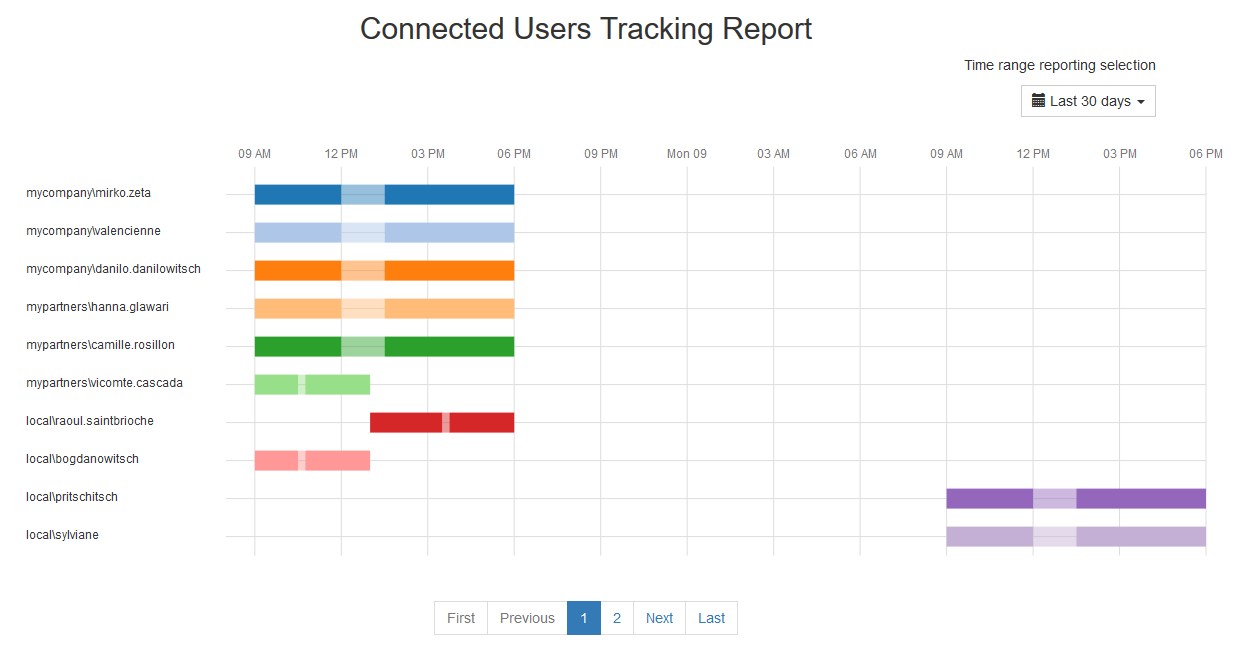
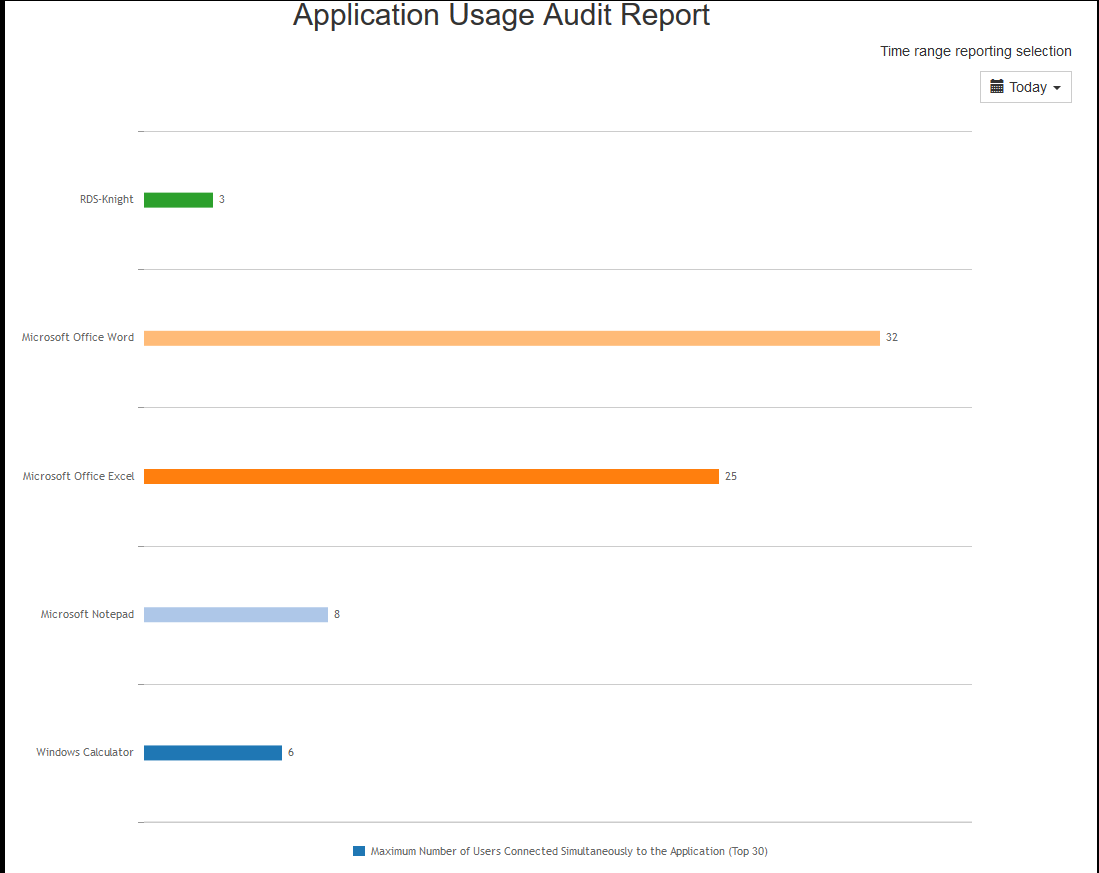
More than a simple monitoring of servers’ infrastructure, Server Genius records remote desktop sessions’ activity. From the moment a user connects to the RDS server until he logs out, any started application will be monitored. The Dashboard then compiles data and displays it in colorful reports. It clearly shows who is using which apps and for how long, on each monitored remote session. It’s the simplest way to get actionable feedback on a business organization’s efficiency. From this point of view, Server Genius is a unique management tool for a better understanding of server's bottlenecks.
Server Genius Reduces Reaction Time for Crisis Management
In addition to these great features, Server Genius includes a variety of options for transmitting important information to decision makers before a crisis emerges. As a first step, administrators should set thresholds in order to define which situations present the greatest risks to their installations. From the new 3.5 release, it is, for example, possible to set alarms (per server) for excessive downtime. If these thresholds are exceeded, Server Genius uses various actions to immediately alert the administrator.
An alert can be automatically sent via email, and since Server Genius version 3.5, also via a browser pop-up notification. With this method, the administrator experiences no loss of productivity. No matter what he is working on, the critical information is displayed in real-time on the screen.
All alerts are then listed in the "alerts" tab following a chronological order as well as problems solved order. With Server Genius 3.7, alerts for events that remain unresolved stay at the top of the list, above the ones that have already been resolved. This helps administrators to become very efficient at managing crises.
The RDS-Tools development team is working on additional features for the next major release of Server Genius. For example, the ability to export reports in PDF formats will be included.
To try Server Genius right now, download the 15 day free trial.
For more information, visit https://www.rds-tools.com/ to discover all tools for RDS administrators.
And to receive information on future enhancements before anyone else, subscribe to the RDS-tools Newsletter or follow their Facebook page!
Source: RDS-tools
Share: